A map is MR12: two halves of twelve rounds, sides switch at the break, first
to 13 takes the map. Every round is an economy puzzle and a scripted tactic, weighted by your players’ role ratings, not a coin flip.
“It feels random”
Results are not RNG: the sim picks a winner from squad power, map strength, the Elo gap and
team morale, then loads the round dice by ability.
MR12 · overtime · Bo1 / Bo3 / Bo5 · veto
The match structure
One map: MR12Datamined constants
First half12 roundsYou start one side
Side switch
Second half12 roundsSides flip
Map winFirst to 1324-round regulation
12–12A tie triggers overtime: MR3 (3 rounds per side, first to 4).
Tied overtimes repeat until one team is ahead by four.
The series
Bo11 map
A single decider: one map, one map veto, high variance. Common in group stages.
Bo3up to 3
First to two maps. The standard playoff format; the veto shapes the whole series.
Bo5up to 5
First to three. Reserved for grand finals: depth of map pool decides it.
Map vetoFirstPick / FirstBan
1Team ABans its worst map
2Team BBans its worst map
3Team APicks a map to play
4Team BPicks a map to play
5BothTrim remaining maps
6·Last map left is the decider
Each team carries a preferred first pick and first ban; the analyst’s pre-match report
advises the order.
Objective, not just fragging
Winning a round
A round is won two or three ways depending on the side. The bomb is the axis: every tactic is
built around planting on A or B, holding the plant, or retaking the site.
TTerrorists win by
Detonating the planted C4 (40s timer)
Eliminating all five CTs
CTCounter-Terrorists win by
Defusing the bomb (10s, or 5s with a kit)
Eliminating all five Ts
Running the round timer out with no plant
Buy states · loss bonus · rewards
The round economy
Money carries between rounds, so the buy you can afford drives the tactic you run. The five
buy states are a hard enum; the dollar figures follow standard CS2 MR12 economy.
The five buy statesEnum · datamined
PistolThe first round of each half: everyone on $800, pistols and light utility only.
Full BuyRifle, armour and a full utility set. Where the scripted executes happen.
Semi BuyA partial buy: some rifles, some armour, thinner utility.
Force BuySpend everything on a weak bank to steal a round or deny the enemy economy.
EcoSave the money, expect to lose the round, keep guns alive for next round.
Loss-bonus ladder$ = CS2 convention
Lose consecutive rounds and your bank floor climbs each time; a single round win resets it.
This is what lets a beaten team re-buy.
$1,400L1
$1,900L2
$2,400L3
$2,900L4
$3,400L5
Round & kill rewards$ = CS2 convention
Round win
$3,250
Bomb detonation (T)
$3,500
Plant (even on a loss)
+$800
Kill (most weapons)
$300
Kill with the AWP
$100
Money cap
$16,000
The AWP’s low kill reward is why an AWP-heavy round is an economic gamble.
The win-probability chain
Who wins the map
The auto-match win chance is a pipeline of datamined inputs, best read from the diagram below: staff quality raises map-practice %, which raises win probability.
Squad powerAverage role rating of the five starters
+
Map strength0–100% familiarity for that specific map
+
ERS (Elo)The ladder gap turned into a probability
+
Morale & fitnessTeam-state modifiers on top
=
Win probabilityRolled per map, then animated
Fact vs inferenceWin-chance inputs are datamined; the exact weights are not, since every scoring method is stubbed in the game files.
Per-player row
Reading the live sim
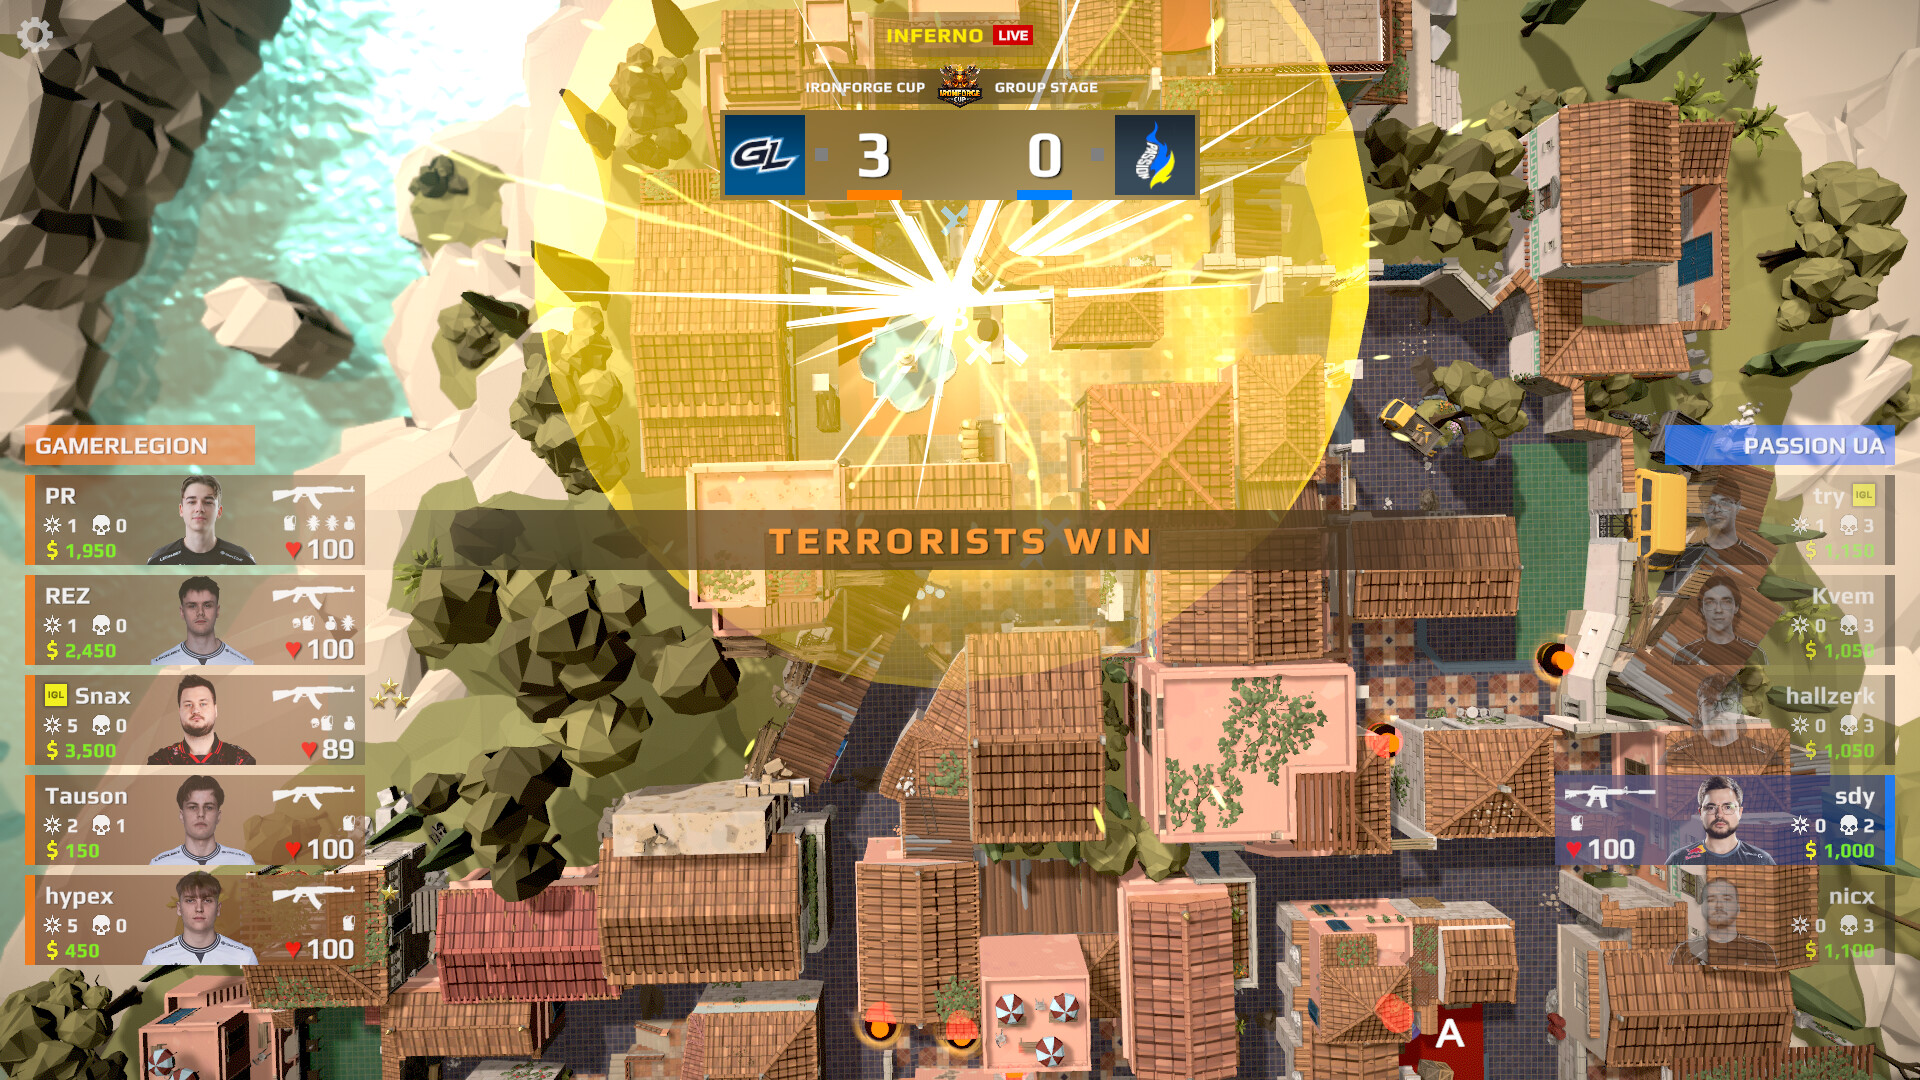
In Simulation Mode you watch the match top-down and call one tactic per round. Your only live
levers are pause, speed and the tactic call; each player’s row reads like a broadcast HUD.
Live sim
Kills columnHP barPlayer moneyIGL badge
Reading a player rowTCT
Kills: the star column. More kills = higher round impact.
Deaths: the skull column. A dead player’s HP is gone for the round.
Money: the per-player bank that decides next round’s buy.
HP: the heart. Full at round start, whittled by damage.
Weapon & nades: the held gun and remaining utility icons.
IGL badge: flags the in-game leader in the row.
The same idea, drawn as a linked scoreboard: two real top-ranked rosters on a top-down,
each marker tied to that player’s season rating, role and top stat.
Illustrative positions: the game ships no in-match coordinates, so the ten spots are
hand-placed. The ratings, roles and top stats are real season values from the player database.
K/D/A · HS% · DMG · MVP
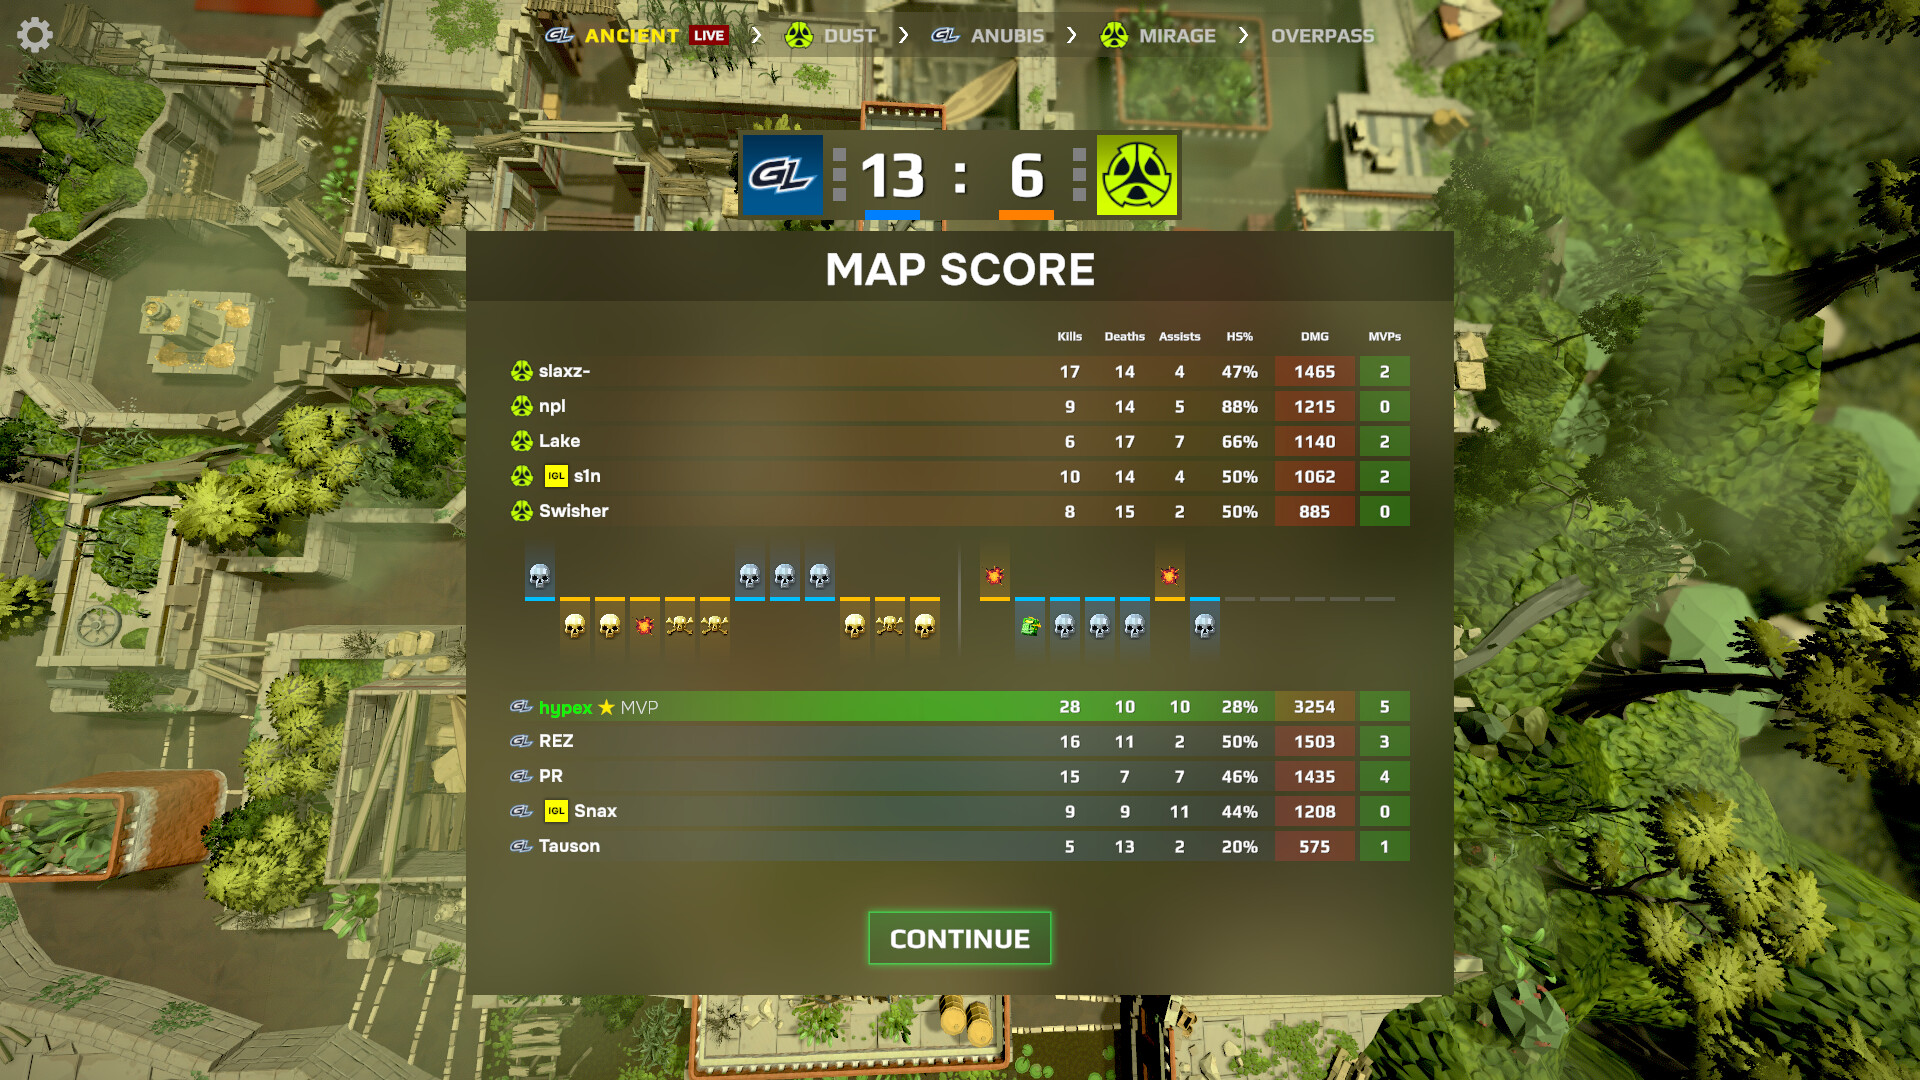
Reading the post-map scoreboard
Post-map scoreboard
Reading the scoreboard
K / D / AKills, Deaths, Assists: assists include flash assists.
HS%Headshot %: headshots over kills; scaled by weapon and aim.
DMGDamage / ADR: average damage per round, the truest fragging metric.
MVP: the map most-valuable-player marker.
Round strip: skull = the round was won by elimination.
Round strip: bomb = the round was won by detonation.
Round strip: defuse kit = the round was won by defuse.
The round-by-round strip runs between the teams: one cell per round, top block for half
one and bottom block for half two, each tinted the winning side’s colour.
Keep reading
The economy decides your buy; the buy decides your tactic,
and the tactic leans on specific player roles.
The rest of the game (staff, training, transfers and finances) lives in the manager guide.
 23452345 17 20 18 16 16 14 18 20 19 16